
Country | Tariffs Charged to the U.S.A. (%) | U.S.A. Discounted Reciprocal Tariffs (%) |
| China | 67 | 34 |
| European Union | 39 | 20 |
| Vietnam | 90 | 46 |
| Taiwan | 64 | 32 |
| Japan | 46 | 24 |
| India | 52 | 26 |
| South Korea | 50 | 25 |
| Thailand | 72 | 36 |
| Switzerland | 61 | 31 |
| Indonesia | 64 | 32 |
| Malaysia | 47 | 24 |
| Cambodia | 97 | 49 |
| United Kingdom | 10 | 10 |
| South Africa | 60 | 30 |
| Brazil | 10 | 10 |
| Bangladesh | 74 | 37 |
| Singapore | 10 | 10 |
| Israel | 33 | 17 |
| Philippines | 34 | 17 |
| Chile | 10 | 10 |
| Australia | 10 | 10 |
| Pakistan | 58 | 29 |
| Turkey | 10 | 10 |
| Sri Lanka | 88 | 44 |
| Colombia | 10 | 10 |
| Peru | 10 | 10 |
| Nicaragua | 36 | 18 |
| Norway | 30 | 15 |
| Costa Rica | 17 | 10 |
| Jordan | 40 | 20 |
| Dominican Republic | 10 | 10 |
| United Arab Emirates | 10 | 10 |
| New Zealand | 20 | 10 |
| Argentina | 10 | 10 |
| Ecuador | 12 | 10 |
| Guatemala | 10 | 10 |
| Honduras | 10 | 10 |
| Madagascar | 93 | 47 |
| Myanmar (Burma) | 88 | 44 |
| Tunisia | 55 | 28 |
| Kazakhstan | 54 | 27 |
| Serbia | 74 | 37 |
| Egypt | 10 | 10 |
| Saudi Arabia | 10 | 10 |
| El Salvador | 10 | 10 |
| Côte d'Ivoire | 41 | 21 |
| Laos | 95 | 48 |
| Botswana | 74 | 37 |
| Trinidad and Tobago | 12 | 10 |
| Morocco | 10 | 10 |
| Papua New Guinea | 15 | 10 |
| Malawi | 34 | 17 |
| Liberia | 10 | 10 |
| British Virgin Islands | 10 | 10 |
| Afghanistan | 49 | 10 |
| Zimbabwe | 35 | 18 |
| Benin | 10 | 10 |
| Barbados | 10 | 10 |
| Monaco | 10 | 10 |
| Syria | 81 | 41 |
| Uzbekistan | 10 | 10 |
| Republic of the Congo | 10 | 10 |
| Djibouti | 10 | 10 |
| French Polynesia | 10 | 10 |
| Cayman Islands | 10 | 10 |
| Kosovo | 10 | 10 |
| Curaçao | 10 | 10 |
| Vanuatu | 44 | 22 |
| Rwanda | 10 | 10 |
| Sierra Leone | 10 | 10 |
| Mongolia | 10 | 10 |
| San Marino | 10 | 10 |
| Antigua and Barbuda | 10 | 10 |
| Bermuda | 10 | 10 |
| Eswatini | 10 | 10 |
| Marshall Islands | 10 | 10 |
| Saint Pierre and Miquelon | 99 | 50 |
| Saint Kitts and Nevis | 10 | 10 |
| Turkmenistan | 10 | 10 |
| Grenada | 10 | 10 |
| Sudan | 10 | 10 |
| Turks and Caicos Islands | 10 | 10 |
| Aruba | 10 | 10 |
| Montenegro | 10 | 10 |
| Saint Helena | 15 | 10 |
| Kyrgyzstan | 10 | 10 |
| Yemen | 10 | 10 |
| Saint Vincent and the Grenadines | 10 | 10 |
| Niger | 10 | 10 |
| Saint Lucia | 10 | 10 |
| Nauru | 59 | 30 |
| Equatorial Guinea | 25 | 13 |
| Iran | 10 | 10 |
| Libya | 61 | 31 |
| Samoa | 10 | 10 |
| Guinea | 10 | 10 |
| Timor-Leste | 10 | 10 |
| Montserrat | 10 | 10 |
| Chad | 26 | 13 |
| Mali | 10 | 10 |
| Algeria | 59 | 30 |
| Oman | 10 | 10 |
| Uruguay | 10 | 10 |
| Bahamas | 10 | 10 |
| Lesotho | 99 | 50 |
| Ukraine | 10 | 10 |
| Bahrain | 10 | 10 |
| Qatar | 10 | 10 |
| Mauritius | 80 | 40 |
| Fiji | 63 | 32 |
| Iceland | 10 | 10 |
| Kenya | 10 | 10 |
| Liechtenstein | 73 | 37 |
| Guyana | 76 | 38 |
| Haiti | 10 | 10 |
| Bosnia and Herzegovina | 70 | 35 |
| Nigeria | 27 | 14 |
| Namibia | 42 | 21 |
| Brunei | 47 | 24 |
| Bolivia | 20 | 10 |
| Panama | 10 | 10 |
| Venezuela | 29 | 15 |
| North Macedonia | 65 | 33 |
| Ethiopia | 10 | 10 |
| Ghana | 17 | 10 |
| Moldova | 61 | 31 |
| Angola | 63 | 32 |
| Democratic Republic of the Congo | 22 | 11 |
| Jamaica | 10 | 10 |
| Mozambique | 31 | 16 |
| Paraguay | 10 | 10 |
| Zambia | 33 | 17 |
| Lebanon | 10 | 10 |
| Tanzania | 10 | 10 |
| Iraq | 78 | 39 |
| Georgia | 10 | 10 |
| Senegal | 10 | 10 |
| Azerbaijan | 10 | 10 |
| Cameroon | 22 | 11 |
| Uganda | 20 | 10 |
| Albania | 10 | 10 |
| Armenia | 10 | 10 |
| Nepal | 10 | 10 |
| Sint Maarten | 10 | 10 |
| Falkland Islands | 82 | 41 |
| Gabon | 10 | 10 |
| Kuwait | 10 | 10 |
| Togo | 10 | 10 |
| Suriname | 10 | 10 |
| Belize | 10 | 10 |
| Maldives | 10 | 10 |
| Tajikistan | 10 | 10 |
| Cabo Verde | 10 | 10 |
| Burundi | 10 | 10 |
| Guadeloupe | 10 | 10 |
| Bhutan | 10 | 10 |
| Martinique | 10 | 10 |
| Tonga | 10 | 10 |
| Mauritania | 10 | 10 |
| Dominica | 10 | 10 |
| Micronesia | 10 | 10 |
| Gambia | 10 | 10 |
| French Guiana | 10 | 10 |
| Christmas Island | 10 | 10 |
| Andorra | 10 | 10 |
| Central African Republic | 10 | 10 |
| Solomon Islands | 10 | 10 |
| Mayotte | 10 | 10 |
| Anguilla | 10 | 10 |
| Cocos (Keeling) Islands | 10 | 10 |
| Eritrea | 10 | 10 |
| Cook Islands | 10 | 10 |
| South Sudan | 10 | 10 |
| Comoros | 10 | 10 |
| Kiribati | 10 | 10 |
| Sao Tome and Principe | 10 | 10 |
| Norfolk Island | 58 | 29 |
| Gibraltar | 10 | 10 |
| Tuvalu | 10 | 10 |
| British Indian Ocean Territory | 10 | 10 |
| Tokelau | 10 | 10 |
| Guinea-Bissau | 10 | 10 |
| Svalbard and Jan Mayen | 10 | 10 |
| Heard and McDonald Islands | 10 | 10 |
| Reunion | 73 | 37 |
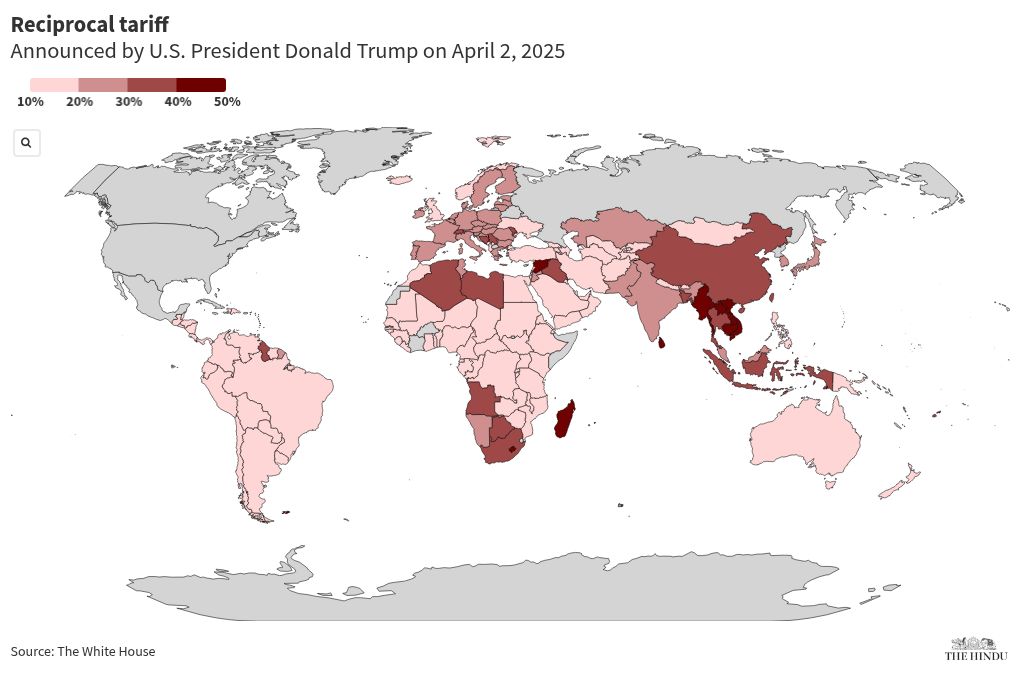
From a preliminary review of the tariff list, we can see several regional trends stand out:
1. East Asia & Southeast Asia – HIGHEST TARIFF RATES
This region faces the most aggressive tariff measures.
The focus is on export-heavy manufacturing countries, particularly those tied to China’s supply chain—including Vietnam, Cambodia, Bangladesh, Myanmar, and Sri Lanka.
China, Vietnam, and Bangladesh are clearly at the center of both tariff cuts and FDI scrutiny.
2. Europe – RELATIVELY MODERATE IMPACT
The EU is hit with mid-level tariffs.
Non-EU countries exporting high-value goods (e.g. Switzerland, Serbia, Liechtenstein) are taxed at higher rates.
The UK and Nordic countries remain relatively “safe,” facing lower tariffs.
3. Latin America – GROUPED UNDER LOWER TARIFFS
Despite Brazil’s strong production capacity, the U.S. is not imposing heavy tariffs—likely to maintain regional political balance.
The region has potential to replace China in supply chains but hasn’t yet emerged as a key high-end export hub.
4. Middle East – MOSTLY STANDARD TARIFFS
Tariffs are largely default-level, as these nations are more energy, finance, and logistics-focused, not manufacturing centers.
Iraq’s 78% tariff likely stems from geopolitical factors.
5. Africa – LIGHTEST IMPACT GLOBALLY
Not considered a global manufacturing hub.
The U.S. does not see Africa as a major trade threat—but also does not prioritize it as a China alternative (due to current capacity limitations).
6. India – HELD IN BALANCE
India is viewed as both a competitor and partner to the U.S.
Tariffs remain moderate, likely to keep negotiation channels open and maintain strategic flexibility.
Unlock opportunities! Join our the events to boost your business, connect with industrial stakeholders, and stay ahead in competitive industries.
See DetailsExperience Vietnam's leading industrial ecosystems - up close! Join our network to elevate your brand image and visibility. Connect with industry experts, showcase your expertise, and gain the spotlight you deserve. Click to learn more and boost your brand today.
See DetailsDeep-dive engagement with a highly filtered audience. Connect with potential overseas partners, and drive growth. Click to explore how we can help you expand your reach and generate leads.
See DetailsA morning of sharp insights and real connections at NEPCON Theater, VEC Hanoi. Industrial zone developers, investment specialists, and technology leaders shared on-the-ground perspectives on Northern Vietnam's high-tech manufacturing landscape.
Monday, 10 Aug, 2026
EuroCham’s Q1 2026 Business Confidence Index shows Vietnam remains a strategic investment destination for European companies. The index fell to 72.7, but 93% of respondents still recommend Vietnam, supported by resilient revenue performance, domestic market strength, and continued long-term growth confidence.
Thursday, 16 Apr, 2026
March 2026 brought a wide range of important tax-related updates across tax administration, corporate income tax, personal income tax, value-added tax, fees and charges, e-invoicing, household business taxation, import-export tax, customs procedures, special consumption tax, environmental protection tax, and accounting.
Monday, 06 Apr, 2026
Last Friday evening, we welcomed a full-capacity room of professionals from across Vietnam’s industrial and manufacturing ecosystem.
Saturday, 21 Mar, 2026
Green buildings are entering a new phase. International standards are shifting away from a narrow focus on energy savings and moving toward a bigger question: How much carbon a building creates across its entire life?.
Monday, 16 Mar, 2026
Organized by Cross Connect Club, in collaboration with the Vietnam Industrial Zone Community, and supported by leading international business associations, the Vietnam Industrial Tour | TECHFEST + Nam Dinh Vu IP has successfully wrapped up—leaving behind lasting connections, industry insights, and strong momentum for future collaboration.
Saturday, 11 Oct, 2025